SK hynix Tube T31 Stick SSD Review: Bridging Solution Springs A Surprise
by Ganesh T S on April 15, 2024 8:00 AM EST- Posted in
- Storage
- SSDs
- flash
- DAS
- JMicron
- SK Hynix
- USB 3.2 Gen 2
- Portable SSDs
Performance Benchmarks
Benchmarks such as ATTO and CrystalDiskMark help provide a quick look at the performance of the direct-attached storage device. The results translate to the instantaneous performance numbers that consumers can expect for specific workloads, but do not account for changes in behavior when the unit is subject to long-term conditioning and/or thermal throttling. Yet another use of these synthetic benchmarks is the ability to gather information regarding support for specific storage device features that affect performance.
Synthetic Benchmarks - ATTO and CrystalDiskMark
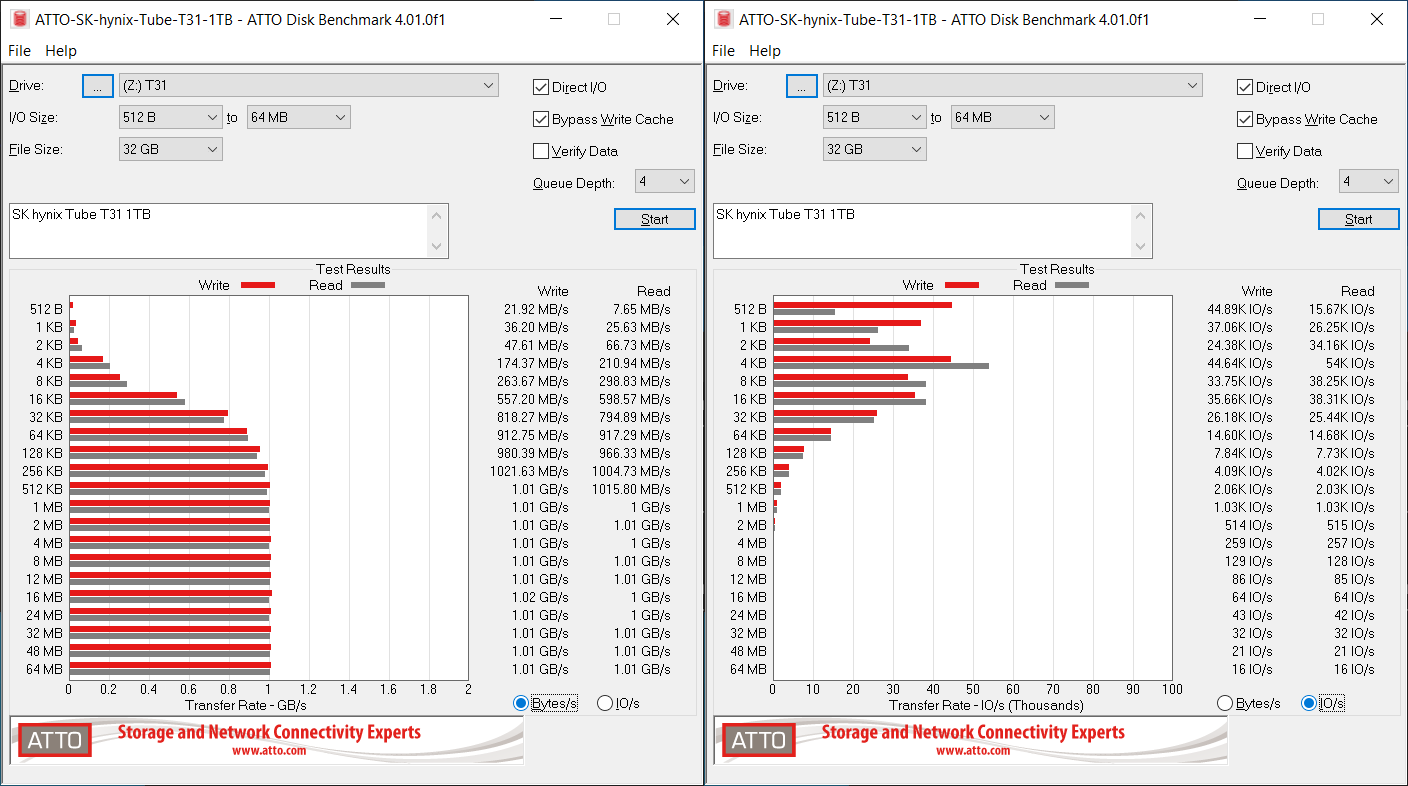
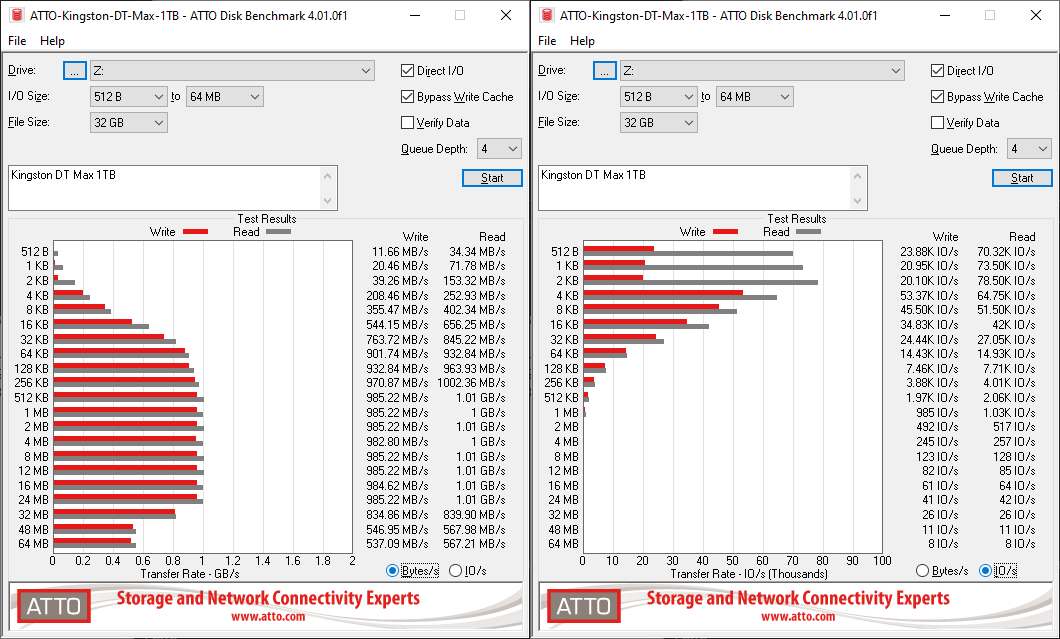
SK hynix claims sequential read and write speeds of up to 1000 MBps. Based on the ATTO benchmarks below, it appears that SK hynix has been a bit conservative in its write speed claims. ATTO benchmarking is restricted to a single configuration in terms of queue depth, and is only representative of a small sub-set of real-world workloads. It does allow the visualization of change in transfer rates as the I/O size changes, with optimal performance being reached around 512 KB for a queue depth of 4.
| ATTO Benchmarks | |
| TOP: | BOTTOM: |
 |
|
 |
|
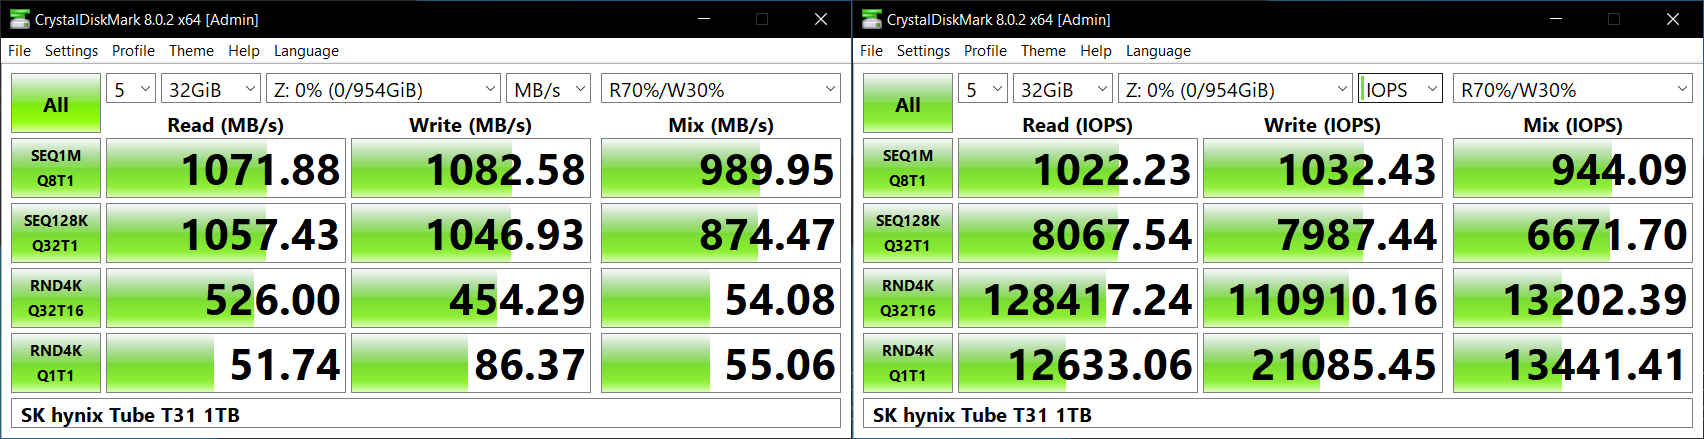
CrystalDiskMark, on the other hand, uses four different access traces for reads and writes over a configurable region size. Two of the traces are sequential accesses, while two are 4K random accesses. Internally, CrystalDiskMark uses the Microsoft DiskSpd storage testing tool. The 'Seq128K Q32T1' sequential traces use 128K block size with a queue depth of 32 from a single thread, while the '4K Q32T16' one does random 4K accesses with the same queue configuration, but from multiple threads. The 'Seq1M' traces use a 1MiB block size. The plain 'Rnd4K' one uses only a single queue and single thread . Comparing the '4K Q32T16' and '4K Q1T1' numbers can quickly tell us whether the storage device supports NCQ (native command queuing) / UASP (USB-attached SCSI protocol). If the numbers for the two access traces are in the same ballpark, NCQ / UASP is not supported. This assumes that the host port / drivers on the PC support UASP.
| CrystalDiskMark Benchmarks | |
| TOP: | BOTTOM: |
 |
|
 |
|
It is clear that the Tube T31 supports UASP and NCQ, but the more interesting aspect is the comparative numbers for random access traces between the Tube 31 and other stick SSDs. While the low queue depth numbers are comparable, the Tube T31 pulls far ahead in the high queue-depth scenarios. This gulf is best explained by the use of a DRAM cache for the flash translation layer in the Tube T31 - something that was not visible in the teardown, but only claimed to be embedded within the package on the M.2 2242 SSD.
AnandTech DAS Suite - Benchmarking for Performance Consistency
Our testing methodology for storage bridges / direct-attached storage units takes into consideration the usual use-case for such devices. The most common usage scenario is transfer of large amounts of photos and videos to and from the unit. Other usage scenarios include the use of the unit as a download or install location for games and importing files directly from it into a multimedia editing program such as Adobe Photoshop. Some users may even opt to boot an OS off an external storage device.
The AnandTech DAS Suite tackles the first use-case. The evaluation involves processing five different workloads:
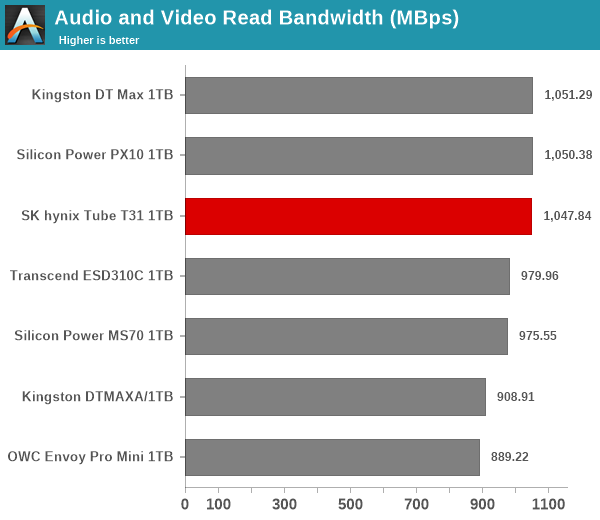
- AV: Multimedia content with audio and video files totalling 24.03 GB over 1263 files in 109 sub-folders
- Home: Photos and document files totalling 18.86 GB over 7627 files in 382 sub-folders
- BR: Blu-ray folder structure totalling 23.09 GB over 111 files in 10 sub-folders
- ISOs: OS installation files (ISOs) totalling 28.61 GB over 4 files in one folder
- Disk-to-Disk: Addition of 223.32 GB spread over 171 files in 29 sub-folders to the above four workloads (total of 317.91 GB over 9176 files in 535 sub-folders)
Except for the 'Disk-to-Disk' workload, each data set is first placed in a 29GB RAM drive, and a robocopy command is issue to transfer it to the external storage unit (formatted in exFAT for flash-based units, and NTFS for HDD-based units).
robocopy /NP /MIR /NFL /J /NDL /MT:32 $SRC_PATH $DEST_PATH
Upon completion of the transfer (write test), the contents from the unit are read back into the RAM drive (read test) after a 10 second idling interval. This process is repeated three times for each workload. Read and write speeds, as well as the time taken to complete each pass are recorded. Whenever possible, the temperature of the external storage device is recorded during the idling intervals. Bandwidth for each data set is computed as the average of all three passes.
The 'Disk-to-Disk' workload involves a similar process, but with one iteration only. The data is copied to the external unit from the CPU-attached NVMe drive, and then copied back to the internal drive. It does include more amount of continuous data transfer in a single direction, as data that doesn't fit in the RAM drive is also part of the workload set.
The Tube T31 performs as well as other stick SSDs in this segment. It does suffer a bit in the disk-to-disk workload that is processed towards the end of the routine, pointing to possible SLC cache sizes and thermal throttling at play. For instantaneous / practical use with small workload sizes under 100GB, the casual user will not encounter any issues with the performance of the Tube T31. However, power users may want to dig deeper to understand the limits of each device. To address this concern, we also instrumented our evaluation scheme for determining performance consistency.
Performance Consistency
Aspects influencing the performance consistency include SLC caching and thermal throttling / firmware caps on access rates to avoid overheating. This is important for power users, as the last thing that they want to see when copying over 100s of GB of data is the transfer rate going down to USB 2.0 speeds.
In addition to tracking the instantaneous read and write speeds of the DAS when processing the AnandTech DAS Suite, the temperature of the drive was also recorded. In earlier reviews, we used to track the temperature all through. However, we have observed that SMART read-outs for the temperature in NVMe SSDs using USB 3.2 Gen 2 bridge chips end up negatively affecting the actual transfer rates. To avoid this problem, we have restricted ourselves to recording the temperature only during the idling intervals. The graphs below present the recorded data.
| AnandTech DAS Suite - Performance Consistency | |
| TOP: | BOTTOM: |
 |
|
 |
|
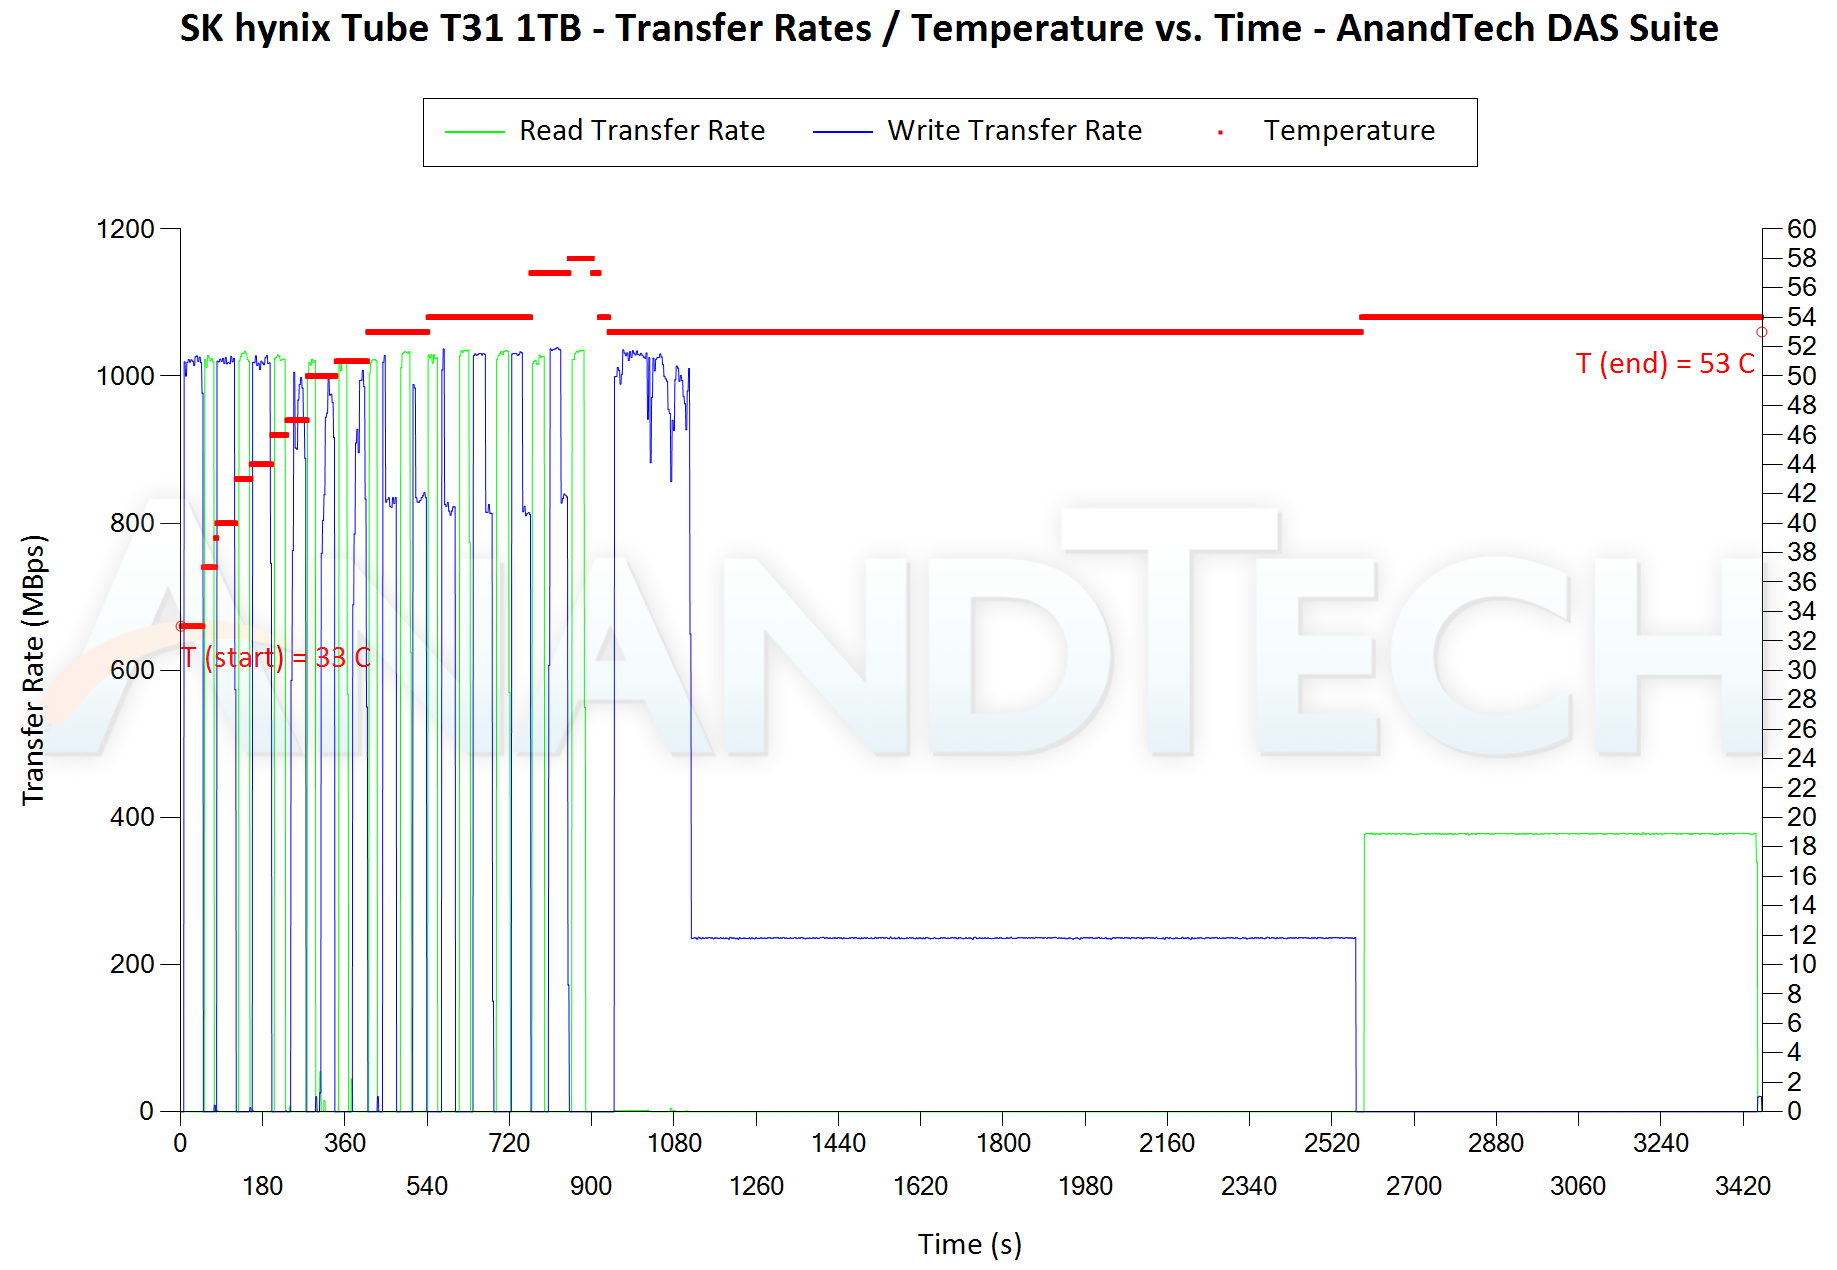
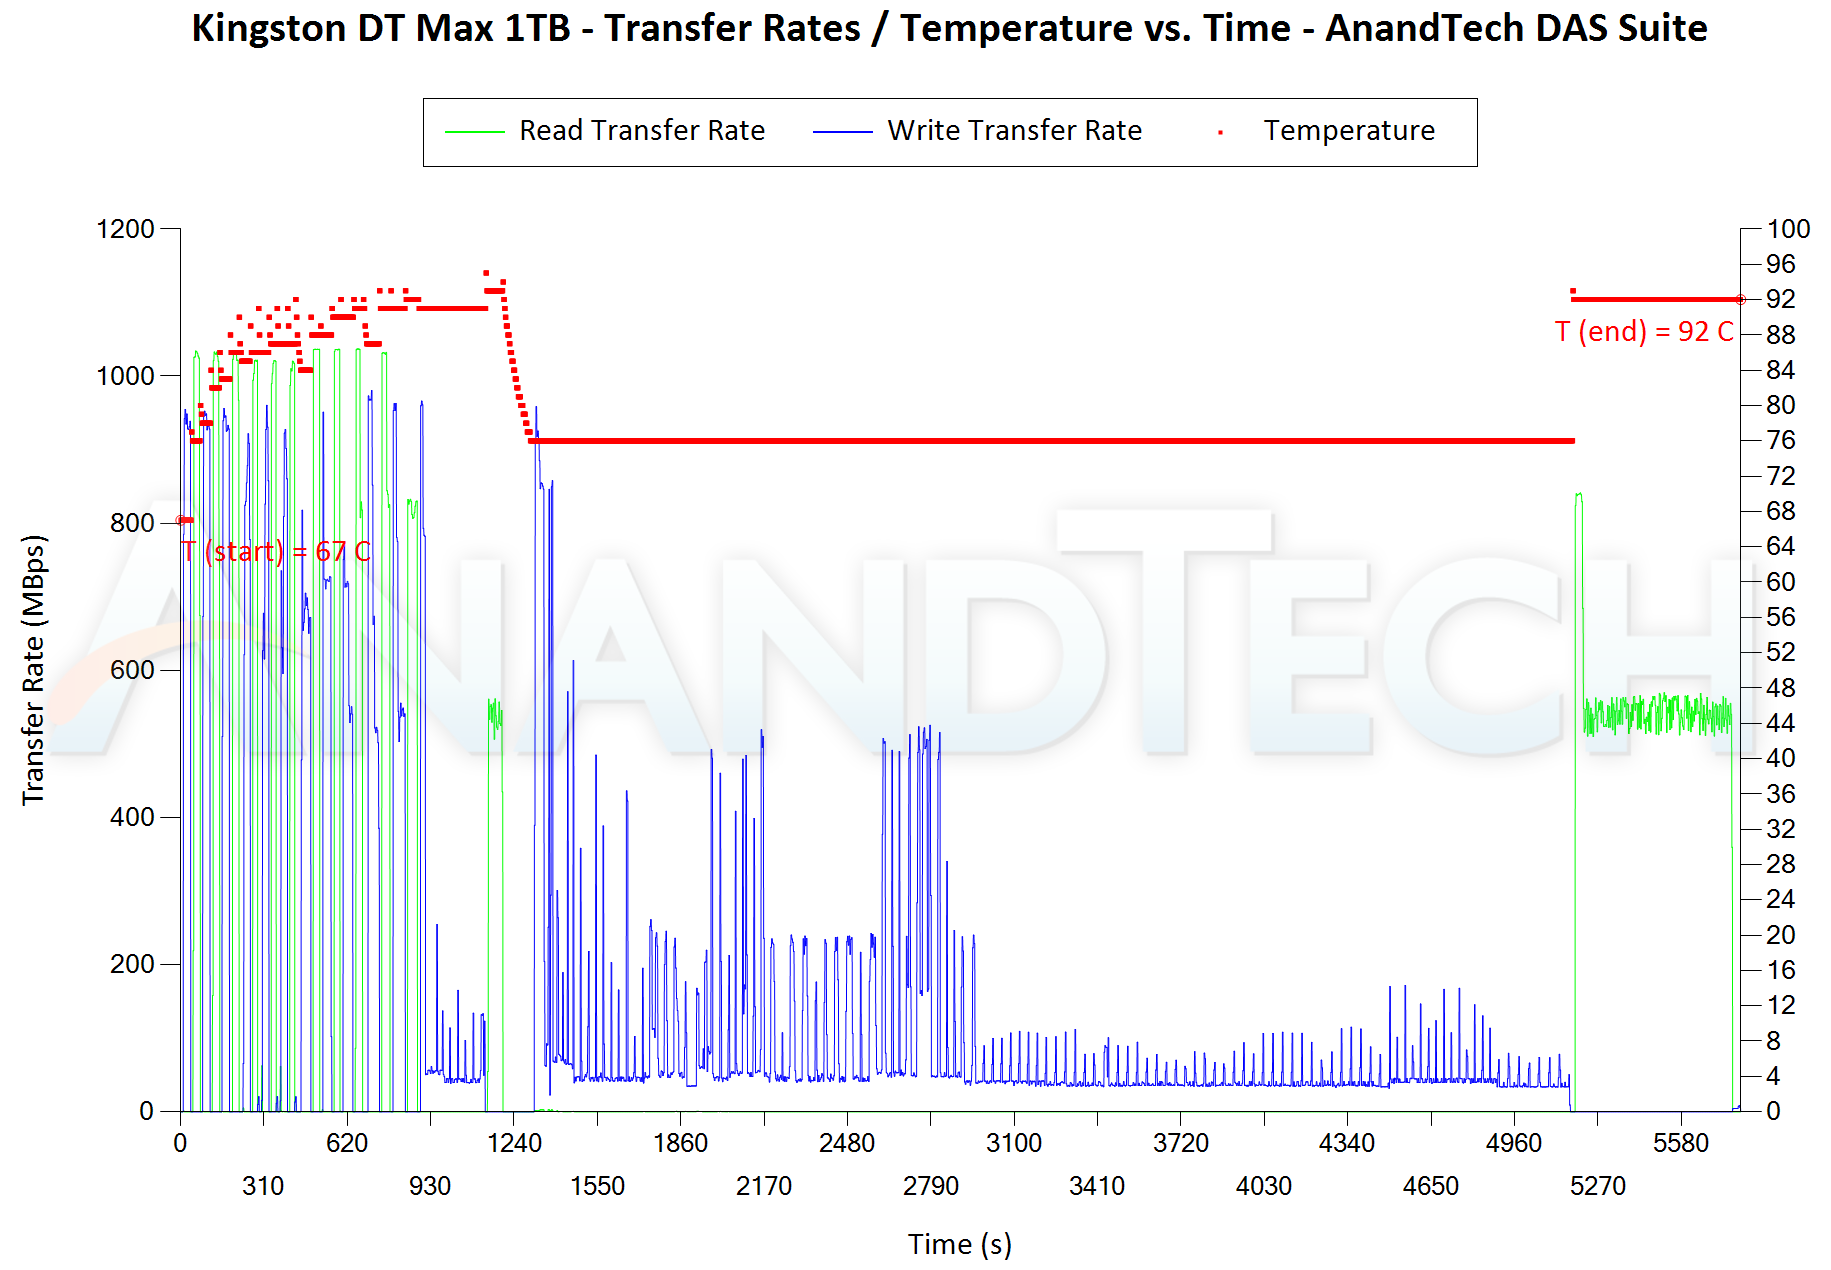
The first three sets of writes and reads correspond to the AV suite. A small gap (for the transfer of the video suite from the internal SSD to the RAM drive) is followed by three sets for the Home suite. Another small RAM-drive transfer gap is followed by three sets for the Blu-ray folder. This is followed up with the large-sized ISO files set. Finally, we have the single disk-to-disk transfer set. These graphs bring out the temporal aspect associated with the numbers in the preceding section's graphs. The SK hynix Tube T31 is able to sustain higher write speeds for a longer duration in the initial benchmark components. However, thermal throttling seems to kick in quite easily - around 55C, and this results in abysmal numbers in the disk-to-disk transfer set after the initial write burst. Sub-400 MBps read speeds over the full duration are not seen even in low-end 1GBps-class stick SSDs, and this was very surprising. Over the last few months, we have subjected portable SSDs under review to an 'extended performance consistency test'. The AnandTech DAS Suite and PCMark 10 Storage Bench (described in the next subsection) are processed four times in succession with a 30 minute gap between the DAS suite and the PCMark 10 bench, and a 1 hour gap between the PCMark 10 bench and the next iteration's DAS suite test.
Keen followers of our portable SSD reviews may notice that the Silicon Power MS70 1TB version makes an appearance in the benchmark numbers above, but only the 2TB version was reviewed earlier this year. Silicon Power had sent over the 1TB version recently to include in our benchmark numbers, and we processed that after evaluating the Tube T31. The instantaneous bandwidth numbers and temperature for the extended performance consistency test are reproduced below.
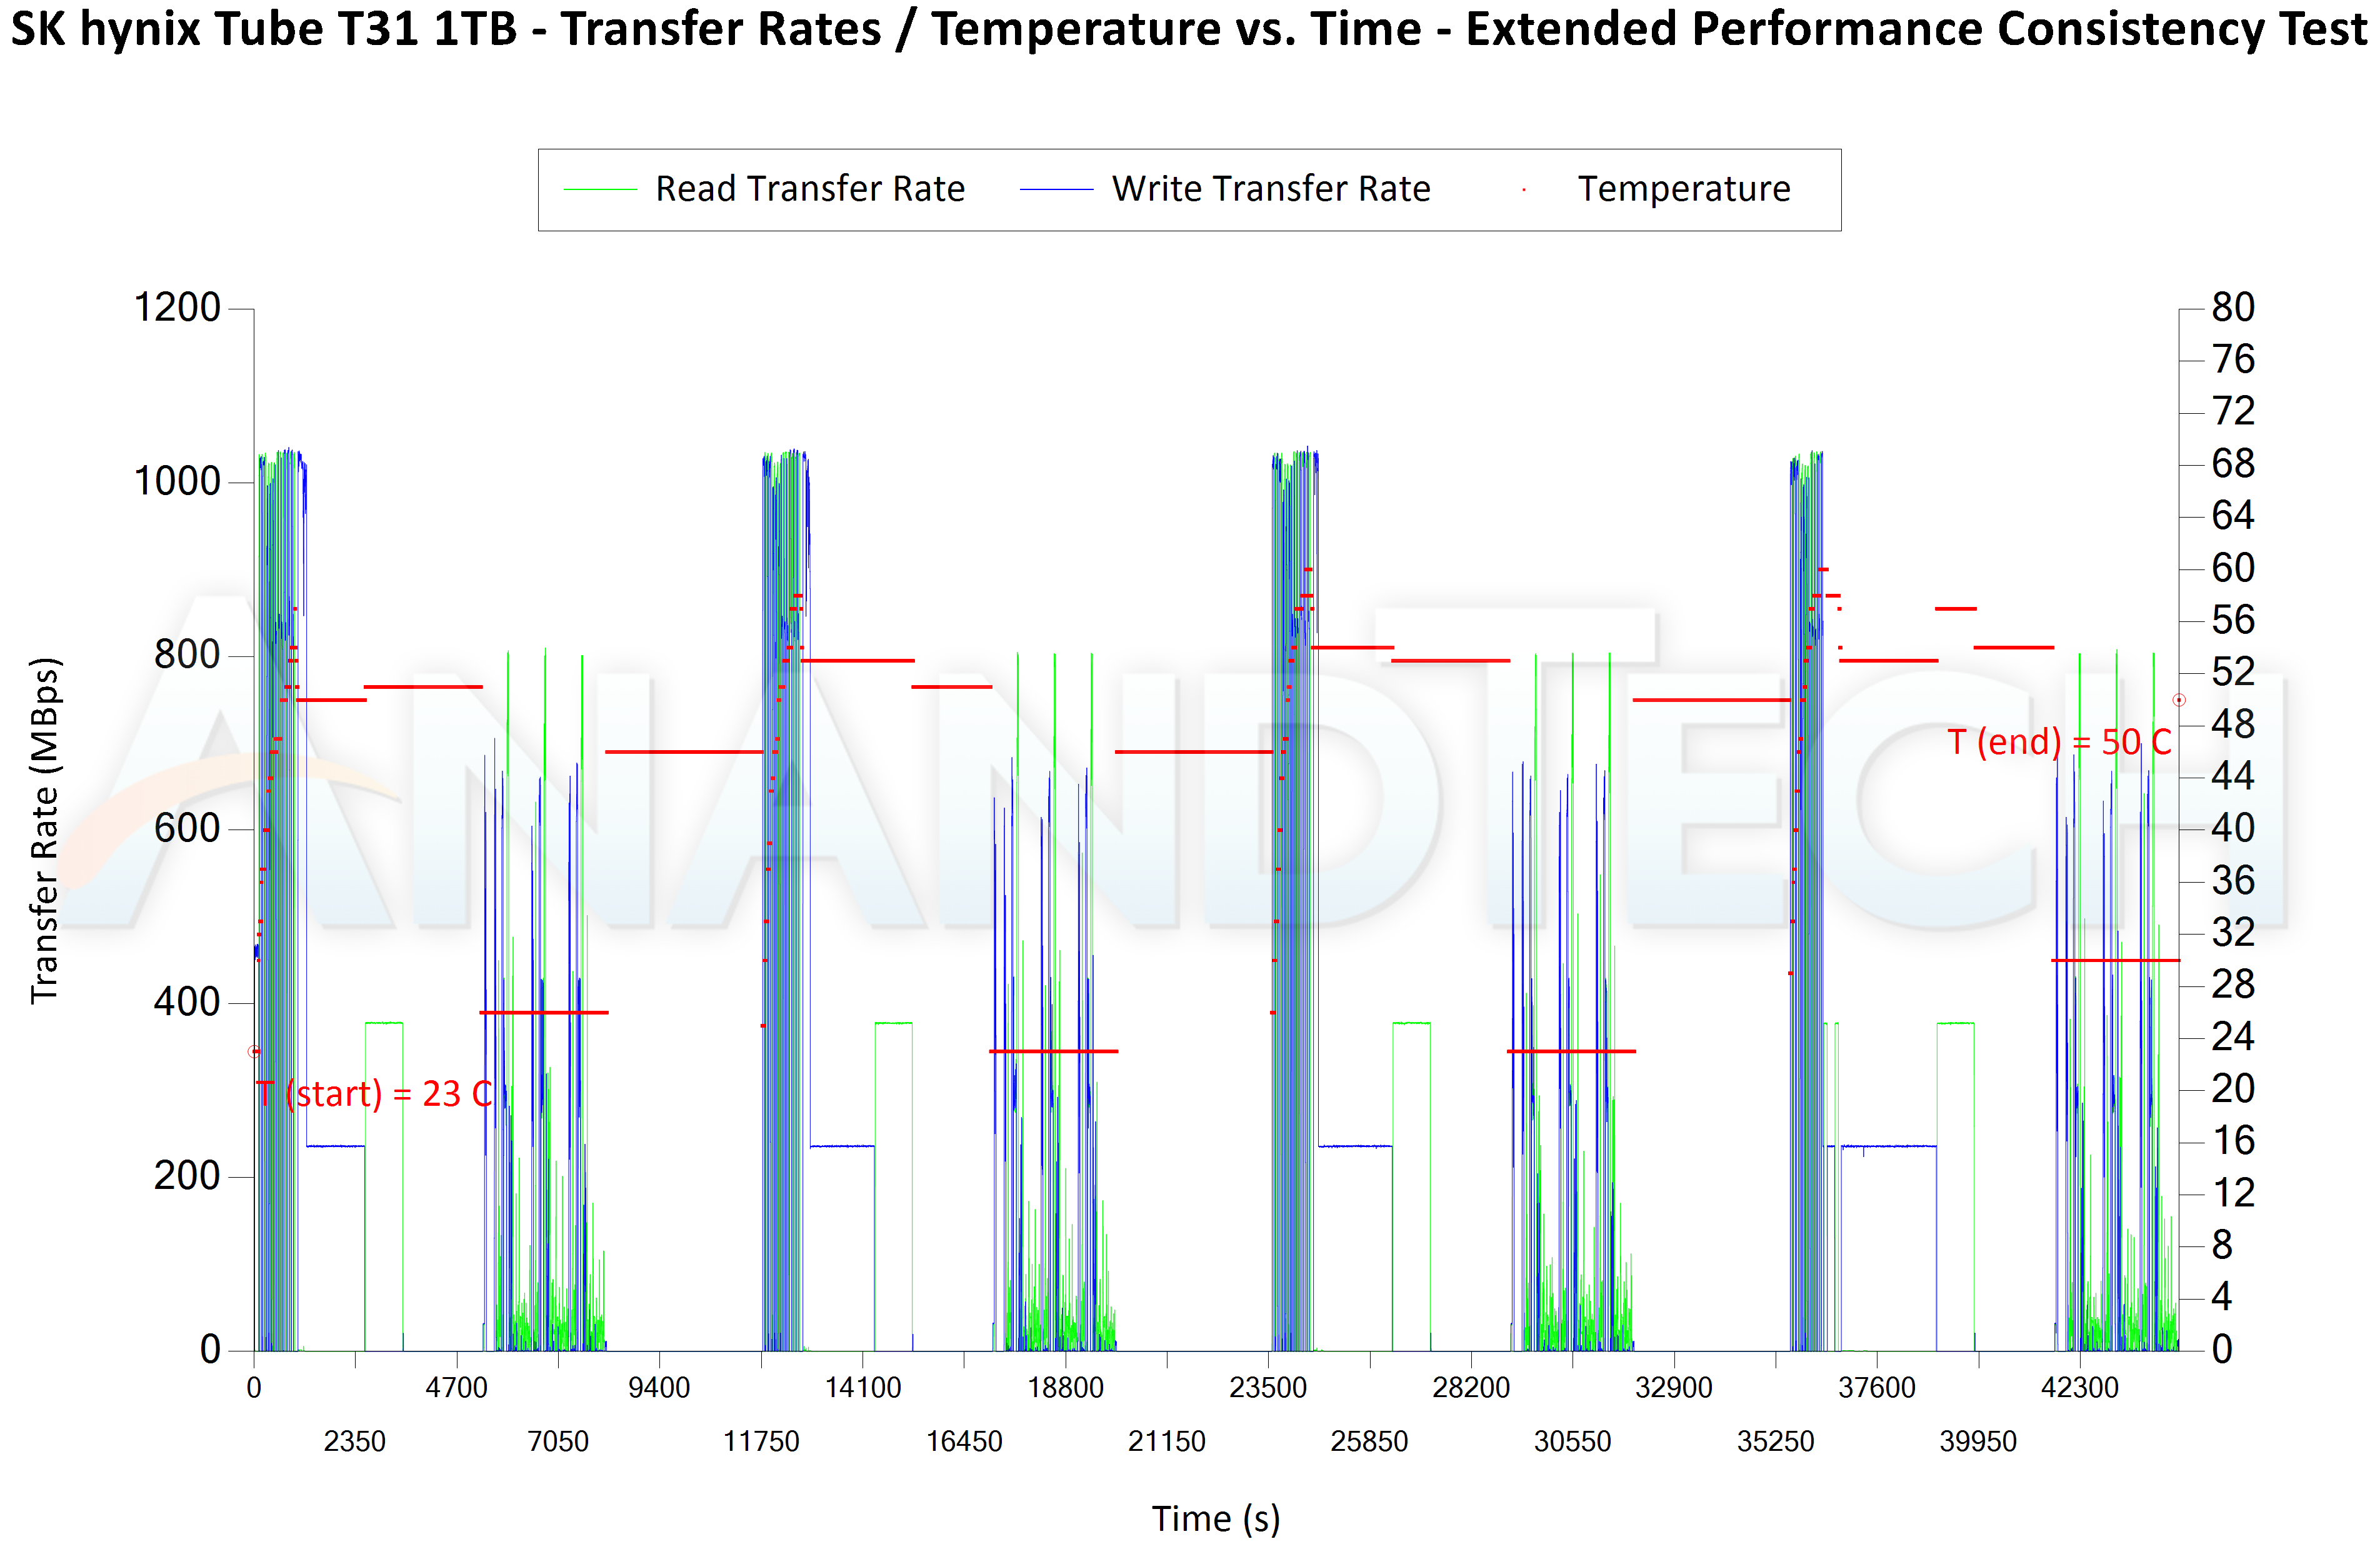
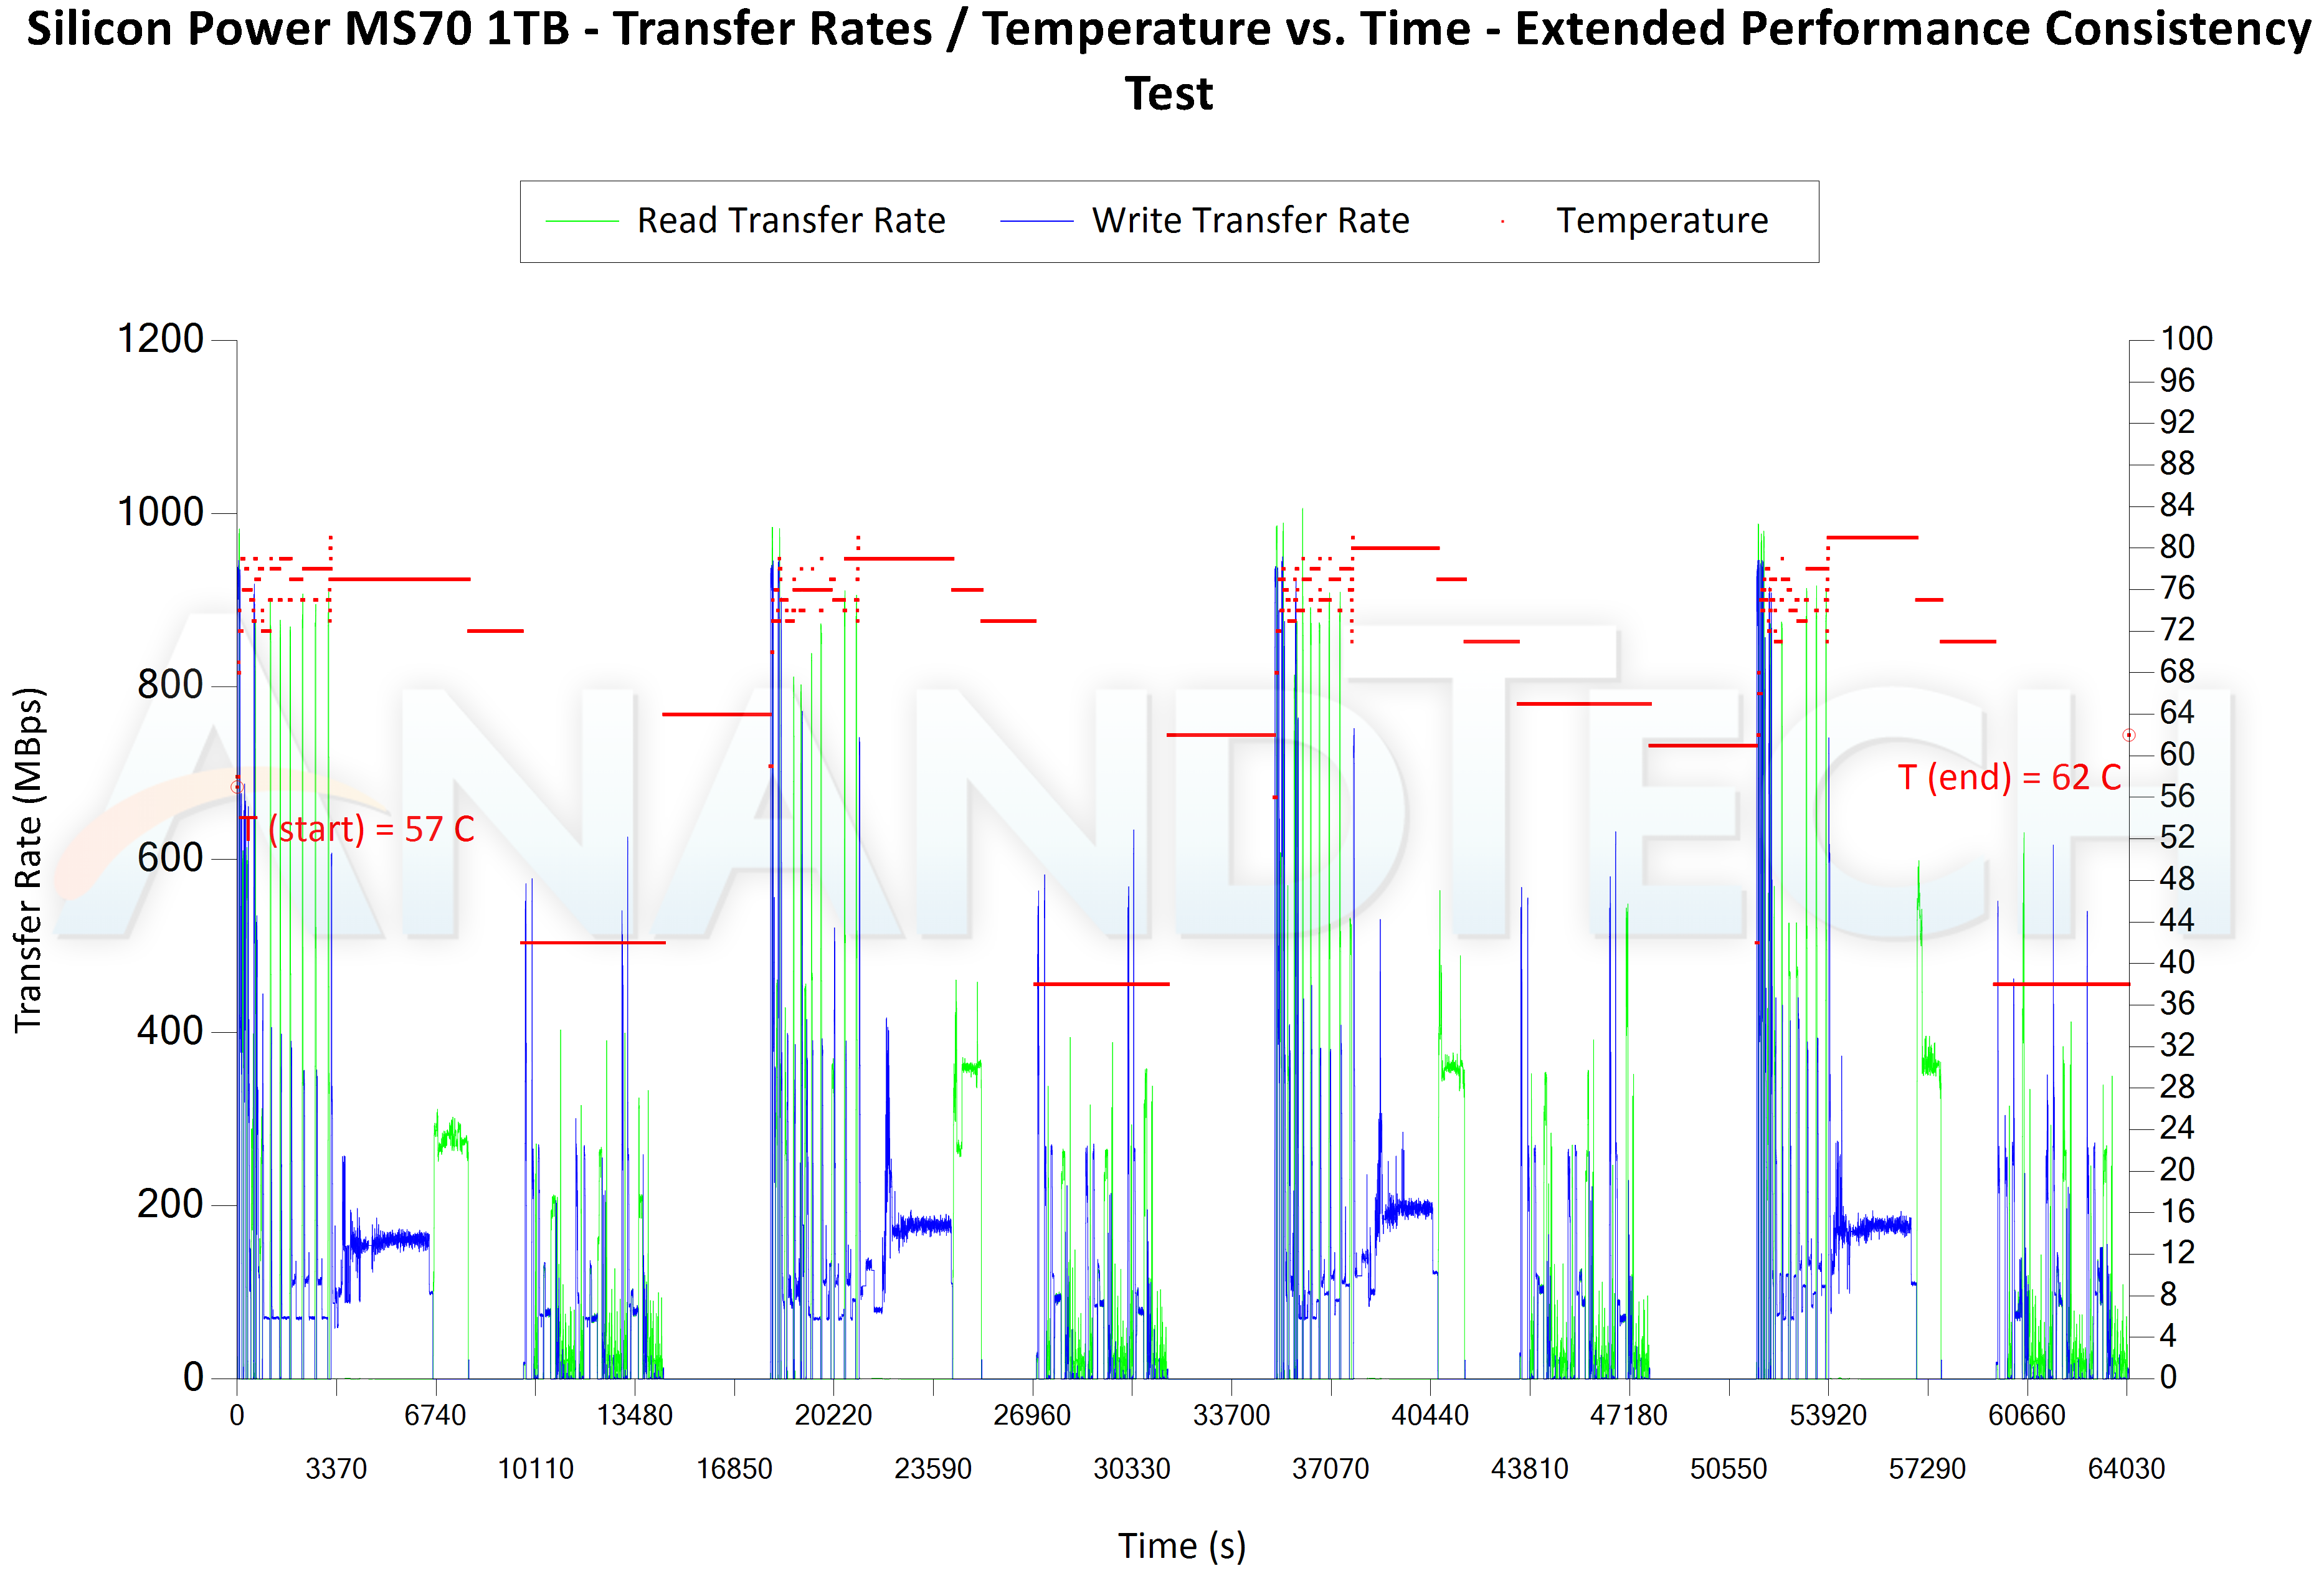
We found that the low disk-to-disk read numbers and capping at 400 MBps were specific to the Tube T31, and the MS70 1TB version performed similar to the 2TB version we had evaluated earlier. This performance profile of the Tube T31 is clearly a result of firmware features that restrict good performance numbers to a small workload set within a given time span.
PCMark 10 Storage Bench - Real-World Access Traces
There are a number of storage benchmarks that can subject a device to artificial access traces by varying the mix of reads and writes, the access block sizes, and the queue depth / number of outstanding data requests. We saw results from two popular ones - ATTO, and CrystalDiskMark - in a previous section. More serious benchmarks, however, actually replicate access traces from real-world workloads to determine the suitability of a particular device for a particular workload. Real-world access traces may be used for simulating the behavior of computing activities that are limited by storage performance. Examples include booting an operating system or loading a particular game from the disk.
PCMark 10's storage bench (introduced in v2.1.2153) includes four storage benchmarks that use relevant real-world traces from popular applications and common tasks to fully test the performance of the latest modern drives:
- The Full System Drive Benchmark uses a wide-ranging set of real-world traces from popular applications and common tasks to fully test the performance of the fastest modern drives. It involves a total of 204 GB of write traffic.
- The Quick System Drive Benchmark is a shorter test with a smaller set of less demanding real-world traces. It subjects the device to 23 GB of writes.
- The Data Drive Benchmark is designed to test drives that are used for storing files rather than applications. These typically include NAS drives, USB sticks, memory cards, and other external storage devices. The device is subjected to 15 GB of writes.
- The Drive Performance Consistency Test is a long-running and extremely demanding test with a heavy, continuous load for expert users. In-depth reporting shows how the performance of the drive varies under different conditions. This writes more than 23 TB of data to the drive.
Despite the data drive benchmark appearing most suitable for testing direct-attached storage, we opt to run the full system drive benchmark as part of our evaluation flow. Many of us use portable flash drives as boot drives and storage for Steam games. These types of use-cases are addressed only in the full system drive benchmark.
The Full System Drive Benchmark comprises of 23 different traces. For the purpose of presenting results, we classify them under five different categories:
- Boot: Replay of storage access trace recorded while booting Windows 10
- Creative: Replay of storage access traces recorded during the start up and usage of Adobe applications such as Acrobat, After Effects, Illustrator, Premiere Pro, Lightroom, and Photoshop.
- Office: Replay of storage access traces recorded during the usage of Microsoft Office applications such as Excel and Powerpoint.
- Gaming: Replay of storage access traces recorded during the start up of games such as Battlefield V, Call of Duty Black Ops 4, and Overwatch.
- File Transfers: Replay of storage access traces (Write-Only, Read-Write, and Read-Only) recorded during the transfer of data such as ISOs and photographs.
PCMark 10 also generates an overall score, bandwidth, and average latency number for quick comparison of different drives. The sub-sections in the rest of the page reference the access traces specified in the PCMark 10 Technical Guide.
Booting Windows 10
The read-write bandwidth recorded for each drive in the boo access trace is presented below.
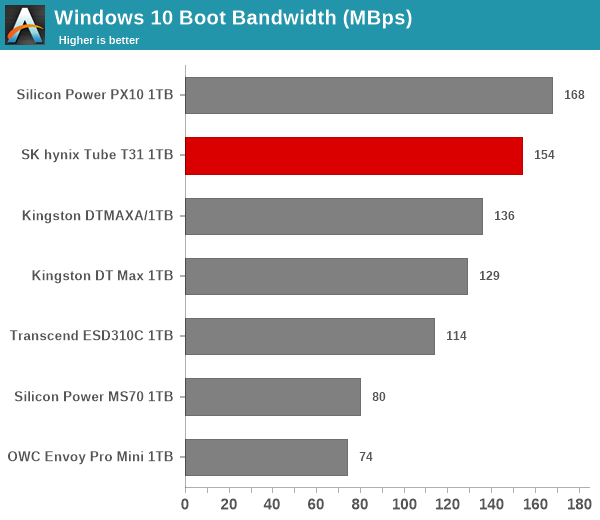
Most of the stick SSDs use a native UFD controller and do not use a DRAM cache for FTL. So, it is no surprise that the Tube T31 manages to outperform all of them in the boot trace. The Tube T31 is bettered only by the other bridge-based PSSD in the mix - the Silicon Power PX10. The PX10 is included in the comparison benchmarks to provide an idea of what a traditional bridge-based PSSD with a bundled cable can achieve.
Creative Workloads
The read-write bandwidth recorded for each drive in the sacr, saft, sill, spre, slig, sps, aft, exc, ill, ind, psh, and psl access traces are presented below.
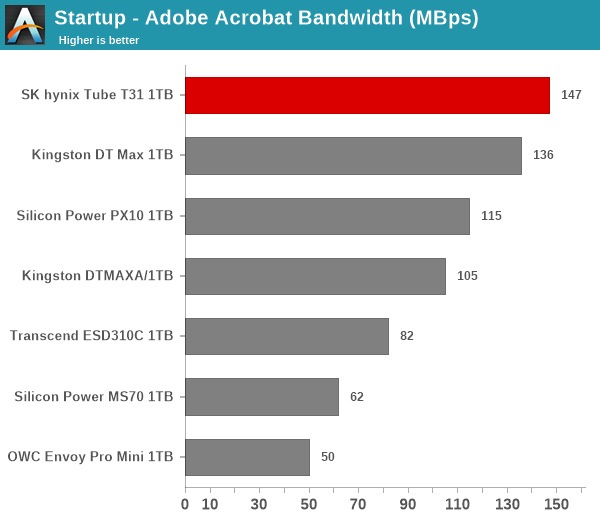
The Tube T31 comes out on top in almost all of the creative workloads, with the Silicon Power PX10 taking the honors in heavy Photoshop trace alone. The benefits of a DRAM-equipped internal SSD in the Tube T31 are evident in these traces. This helps greatly in creative workload traces involving large number of small-sized random accesses.
Office Workloads
The read-write bandwidth recorded for each drive in the exc and pow access traces are presented below.
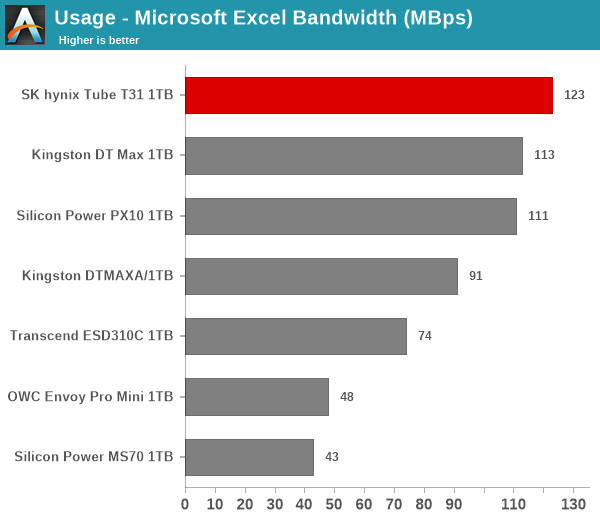
The Tube T31, again thanks to its DRAM-equipped internal SSD, gets top billing in both office workloads involving a large number of random accesses as a percentage of the total set of transactions.
Gaming Workloads
The read-write bandwidth recorded for each drive in the bf, cod, and ow access traces are presented below.
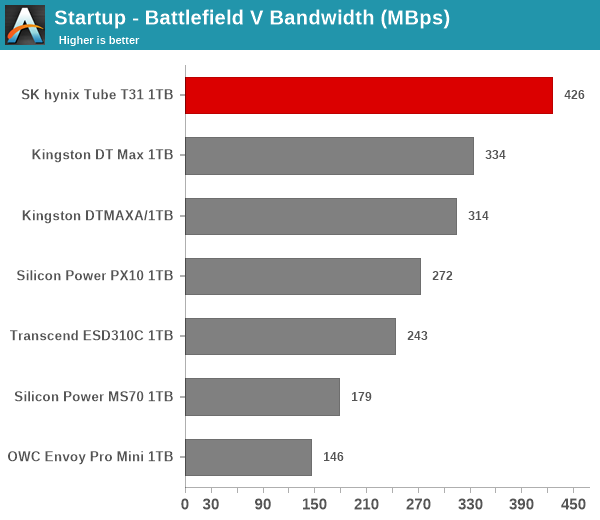
SK hynix plays up XBox and Playstation compatibility as key selling points for the Tube T31. The gaming workloads are largely sequential in nature and most PSSDs don't have much trouble in posting good numbers. The Tube T31 takes the top spot by a good margin in two of the three components and performs almost as well as the leader in the Call of Duty startup trace.
Files Transfer Workloads
The read-write bandwidth recorded for each drive in the cp1, cp2, cp3, cps1, cps2, and cps3 access traces are presented below.
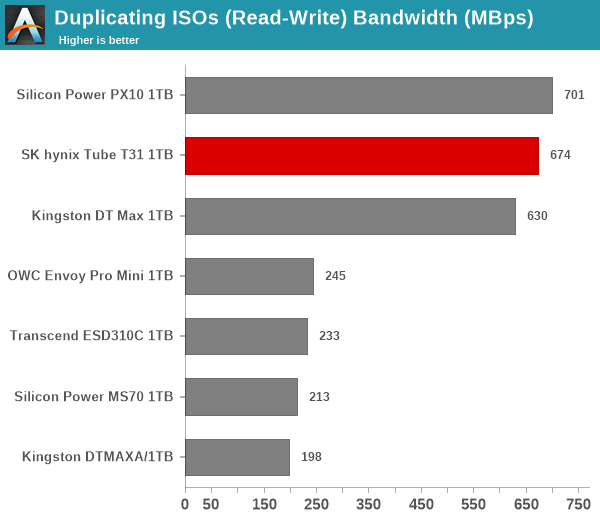
The Tube T31 is on top or a close second in the file transfer workloads. This is essentially the same results that we observed in the AnandTech DAS Suite. As long as the total workload set is within reasonable margins, the Tube T31 performs as advertised.
Overall Scores
PCMark 10 reports an overall score based on the observed bandwidth and access times for the full workload set. The score, bandwidth, and average access latency for each of the drives are presented below.
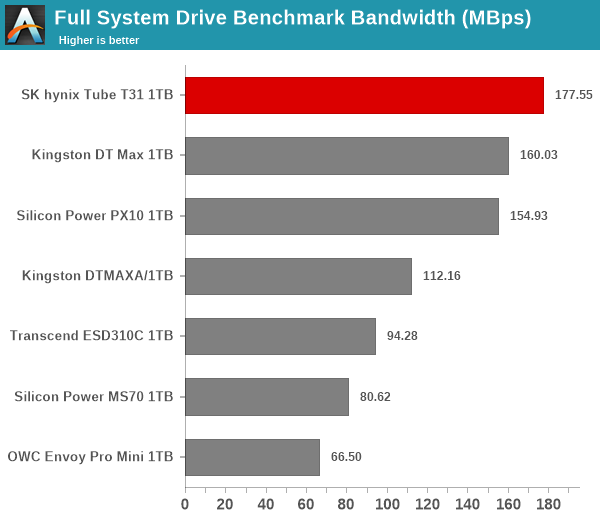
Given the domination of the Tube T31 across a majority of the workloads, it is no surprise that the stick SSD clinches the top spot in the overall scores by a significant margin.


15 Comments
View All Comments
ceisserer - Monday, April 15, 2024 - link
I wonder why no manufacturer recognizes that there indeed is a market for tiny yet fast SSDs.Imagine how small the device could have been, if Hynix would have opted for a custom PCB instead of just putting a standard off-the-shelf SSD into an off-the-self USB/NVMe enclosure. And no, thermals are not the reason, this thing even has a plastic enclusure.
ballsystemlord - Monday, April 15, 2024 - link
You mean like MicroSD?Or USB flash drives?
Or CFcards?
nandnandnand - Monday, April 15, 2024 - link
SD Express has been a complete failure, and there are many complaints about USB flash drives overheating, throttling, failing, and slowing down from peak transfer rates. Maybe it's physically impossible to get the speeds some people are looking for in "thumb drive" and SD/microSD form factors. Give me a cheap USB M.2 2280 PCIe 3.0 x4 enclosure that doesn't overheat and doesn't try to be a bulky stick that blocks ports, and I'll be happy.ballsystemlord - Monday, April 15, 2024 - link
I feel your pain.At the same time though I must point out that it is because of the problems you mentioned above that we have reviews of flash drives on AT. Or, to put it another way, just because it's blue, doesn't mean its USB 3.0+ much less that it can maintain those speeds.
DougMcC - Monday, April 15, 2024 - link
Until you snap off the connector. Which is what you do when you have a relatively large device connected with a thin enough connector not to block ports.TheinsanegamerN - Thursday, April 18, 2024 - link
Well, if manufacturers would stop jamming the USB ports together and stop making machines paper thin, this wouldnt be an issue.Back when I had my Mushkin 256G USB/SSD stick, computers were phat enough that it didnt block any ports.
meacupla - Monday, April 15, 2024 - link
Such things kind of exist?Crucial X9 Pro and Kingston XS2000 use the Silicon Motion SM2320 native USB 20Gbps controller, but said drives use 2x 1TB density, which takes up room.
IDK if SM2320 works with a single BiCS5 chip, but it is available in 2TB density. BiCS5 is used on WD Blue SN570/580 and run cool.
Pair those two, and the drive should end up quite compact.
TheinsanegamerN - Thursday, April 18, 2024 - link
So you're encouraging the use of proprietary components? Gross.Also, why waste the R+D money on such a niche product? It is highly unlikely the extra money spent would ever be recouped VS this product.
artifex - Tuesday, April 16, 2024 - link
It's too bad they never sent you a Beetle to test. Would have been interesting to see the differences in power consumption, heat, etc. If the Tube isn't noticeably better from the different bridge, I don't know why someone would want that stick instead of the small box with a pigtail cable Beetle. That just seems safer to have dangling off any connected device.PeachNCream - Tuesday, April 16, 2024 - link
Since the internal SSD can be easily removed, it would be entirely possible for there to be a SSD lottery where the functional components are concerned and for units sent to reviewers to perform better than the possibly corners-cut-and-pennies-pinched variants that will be sold to the masses. One always has to wonder when it comes to storage since that's been a thing for a while thanks to the simplicity of NAND swaps even at the PCB.